·
8 min
Test Reporting: What Belongs in a Test Report and How to Generate It from the Pipeline

Roman Kirchmeier - Autemos

Test reporting is the practice of stating what was tested, what was found, and which risk stays open at release. The frame for it is ISO/IEC/IEEE 29119-3:2021, which describes 15 document types for test documentation, including the Test status report and the Test completion report as separate types (microTOOL, checked 2026). The older IEEE 829-2008 and its Test Summary Report were superseded in 2013 by the 29119 series (IEEE SA). Most guides stop there, leaving the second half open: how the report gets produced. And a 98 % pass rate says little if nobody counted the unstable runs behind it.
TL;DR: Good test reporting shows coverage against requirements and risks, the defect picture by severity, the residual risk, and a dated release recommendation. ISO/IEC/IEEE 29119-3:2021 supplies the document types, ISTQB v4.0.1 lists the contents of the progress and completion reports. Generate it from the pipeline: JUnit XML from the run, Allure for the rendering, results into Jira/Xray.
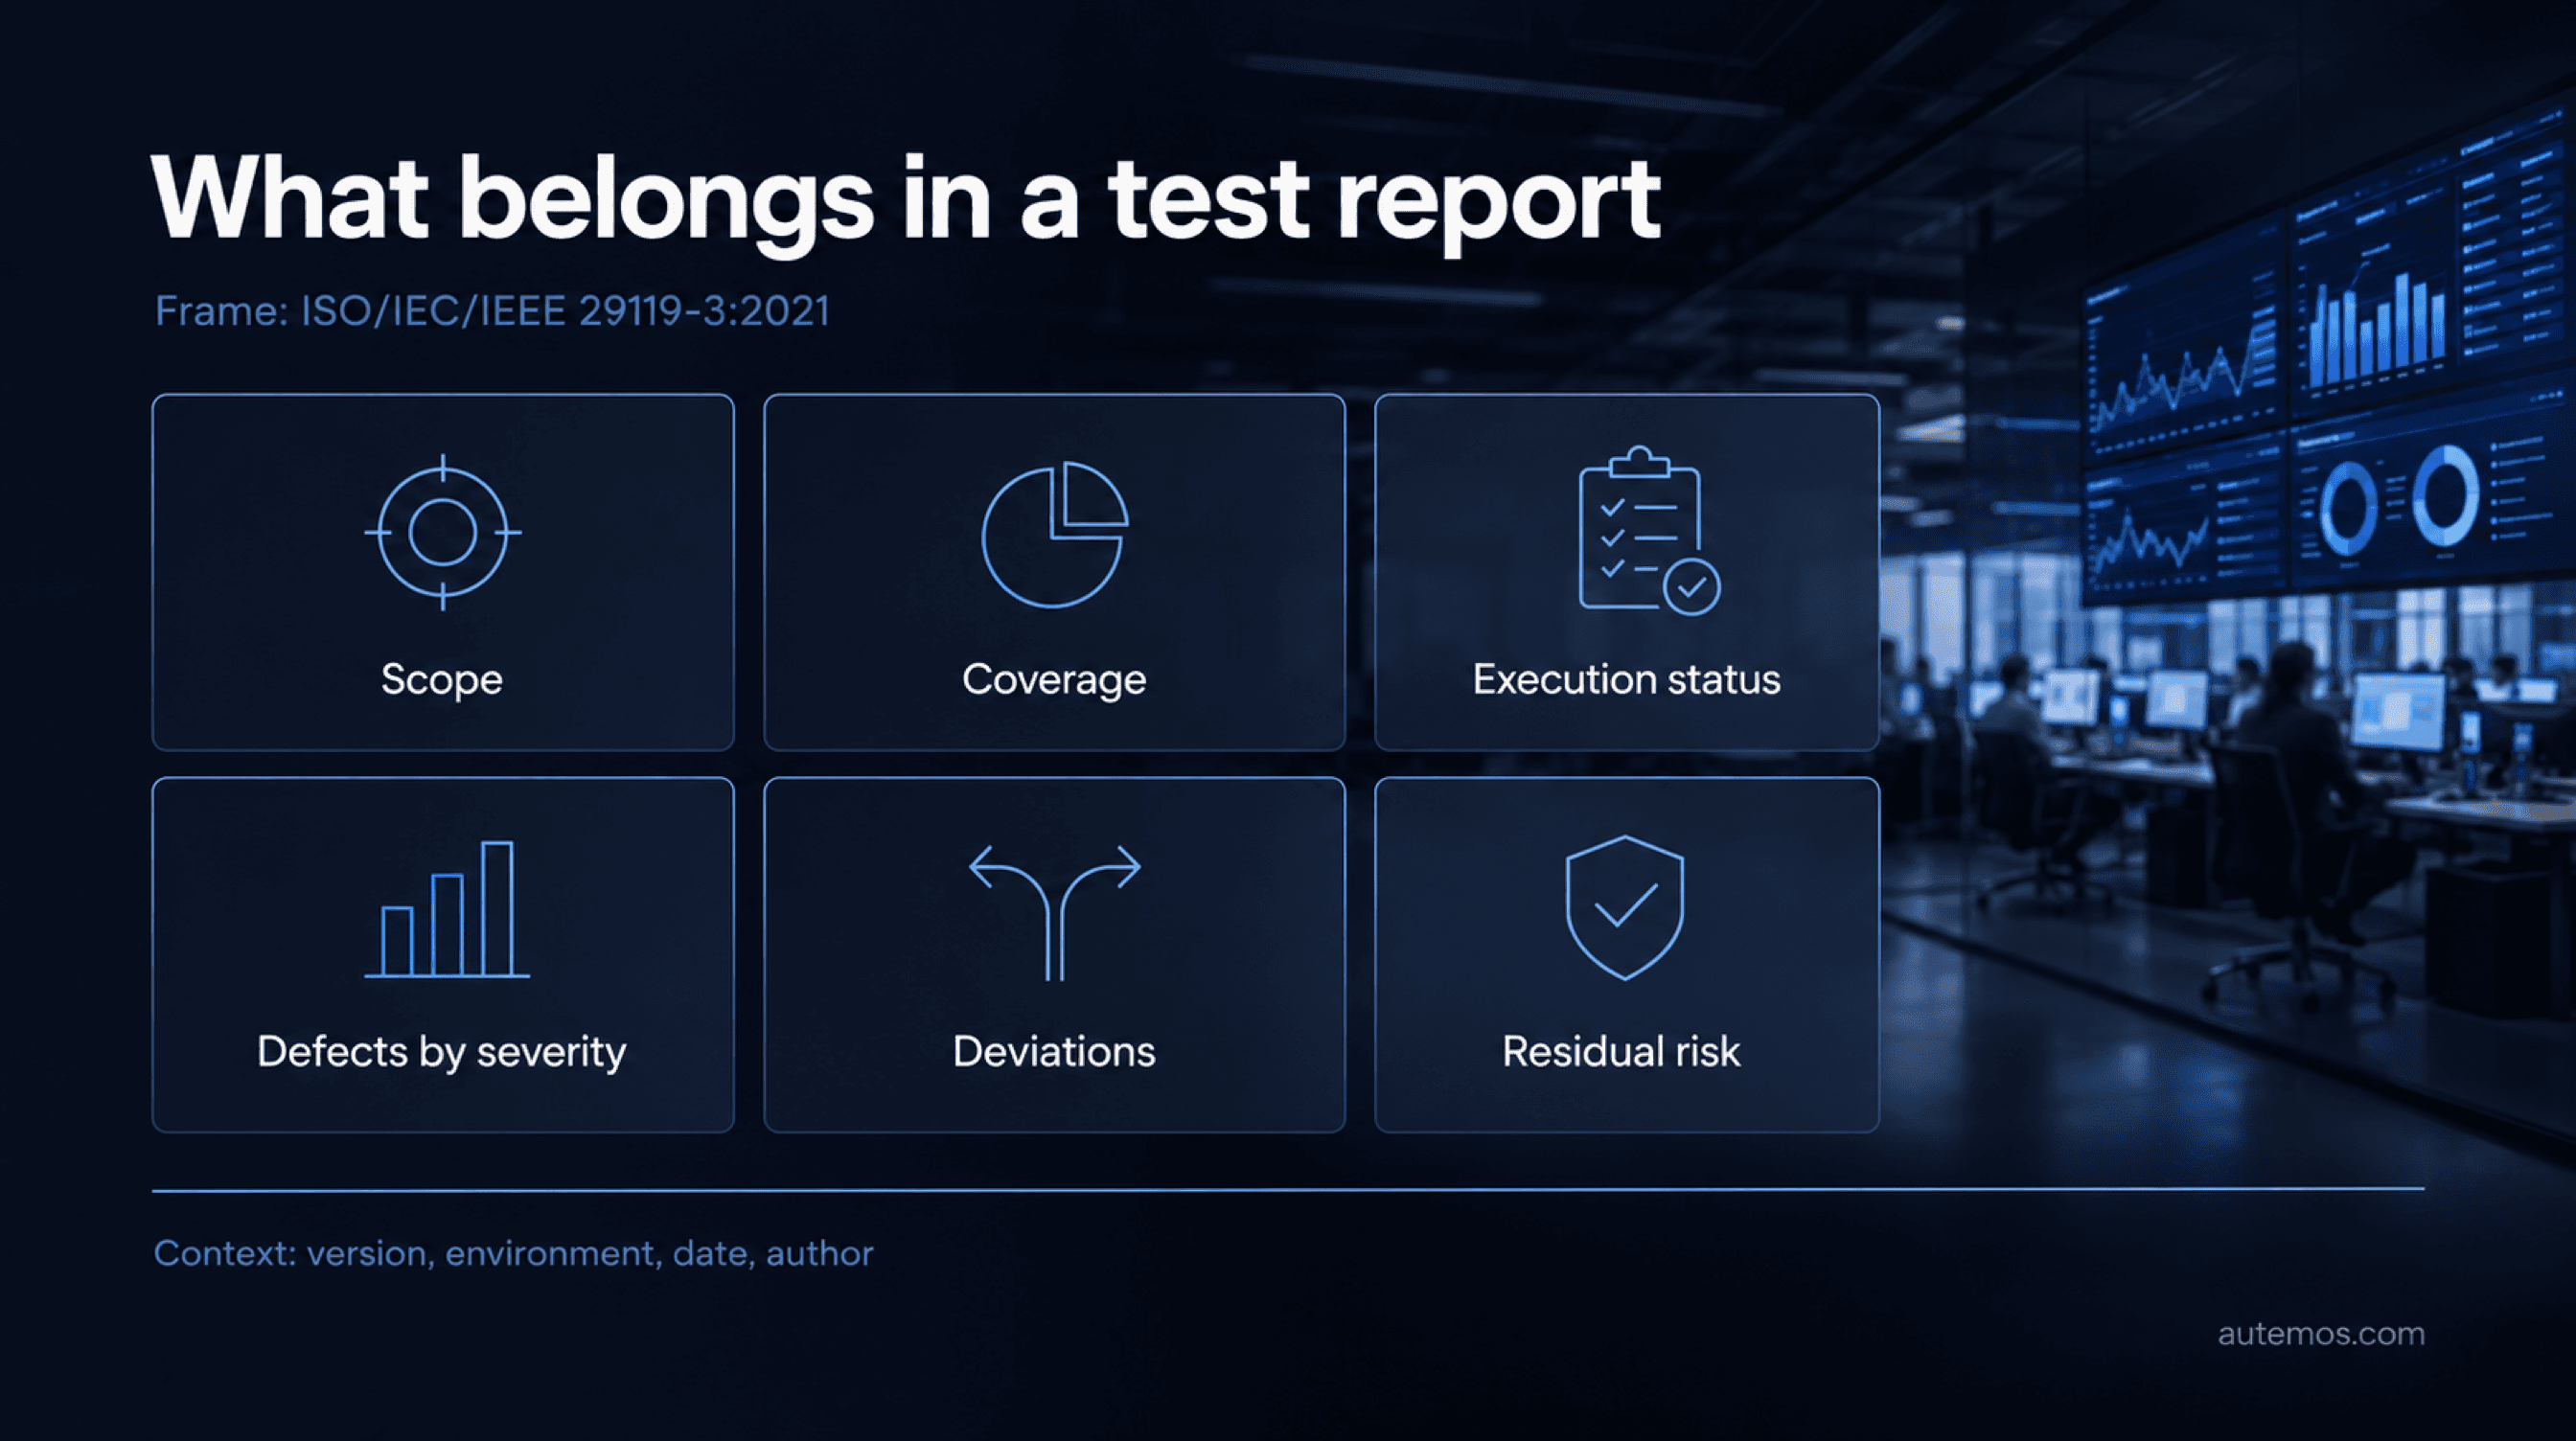
Figure 1: The six core contents of a test report within the ISO/IEC/IEEE 29119-3:2021 frame.
What belongs in a test report?
A test report needs six things: scope, coverage against requirements and risks, execution status, the defect picture by severity and age, deviations from the test plan, and a dated recommendation naming the residual risk. ISO/IEC/IEEE 29119-3:2021 marks its individual information elements as mandatory, recommended or possible rather than prescribing one rigid template.
Context comes on top: test object, version or commit, environment, period, author and date. The standard itself is paywalled, so no clause quotations here. For how test reporting fits the wider process, see our overview of test management.
Test progress report or test completion report: which one, when?
ISTQB separates two report types with different purposes: test progress reports steer an ongoing test effort, test completion reports judge a finished activity. Section 5.3.2 of the syllabus, “Purpose, Content and Audience for Test Reports”, puts the task plainly: “Test reporting summarizes and communicates test information during and after testing.” (ISTQB CTFL Syllabus v4.0.1, 2024).
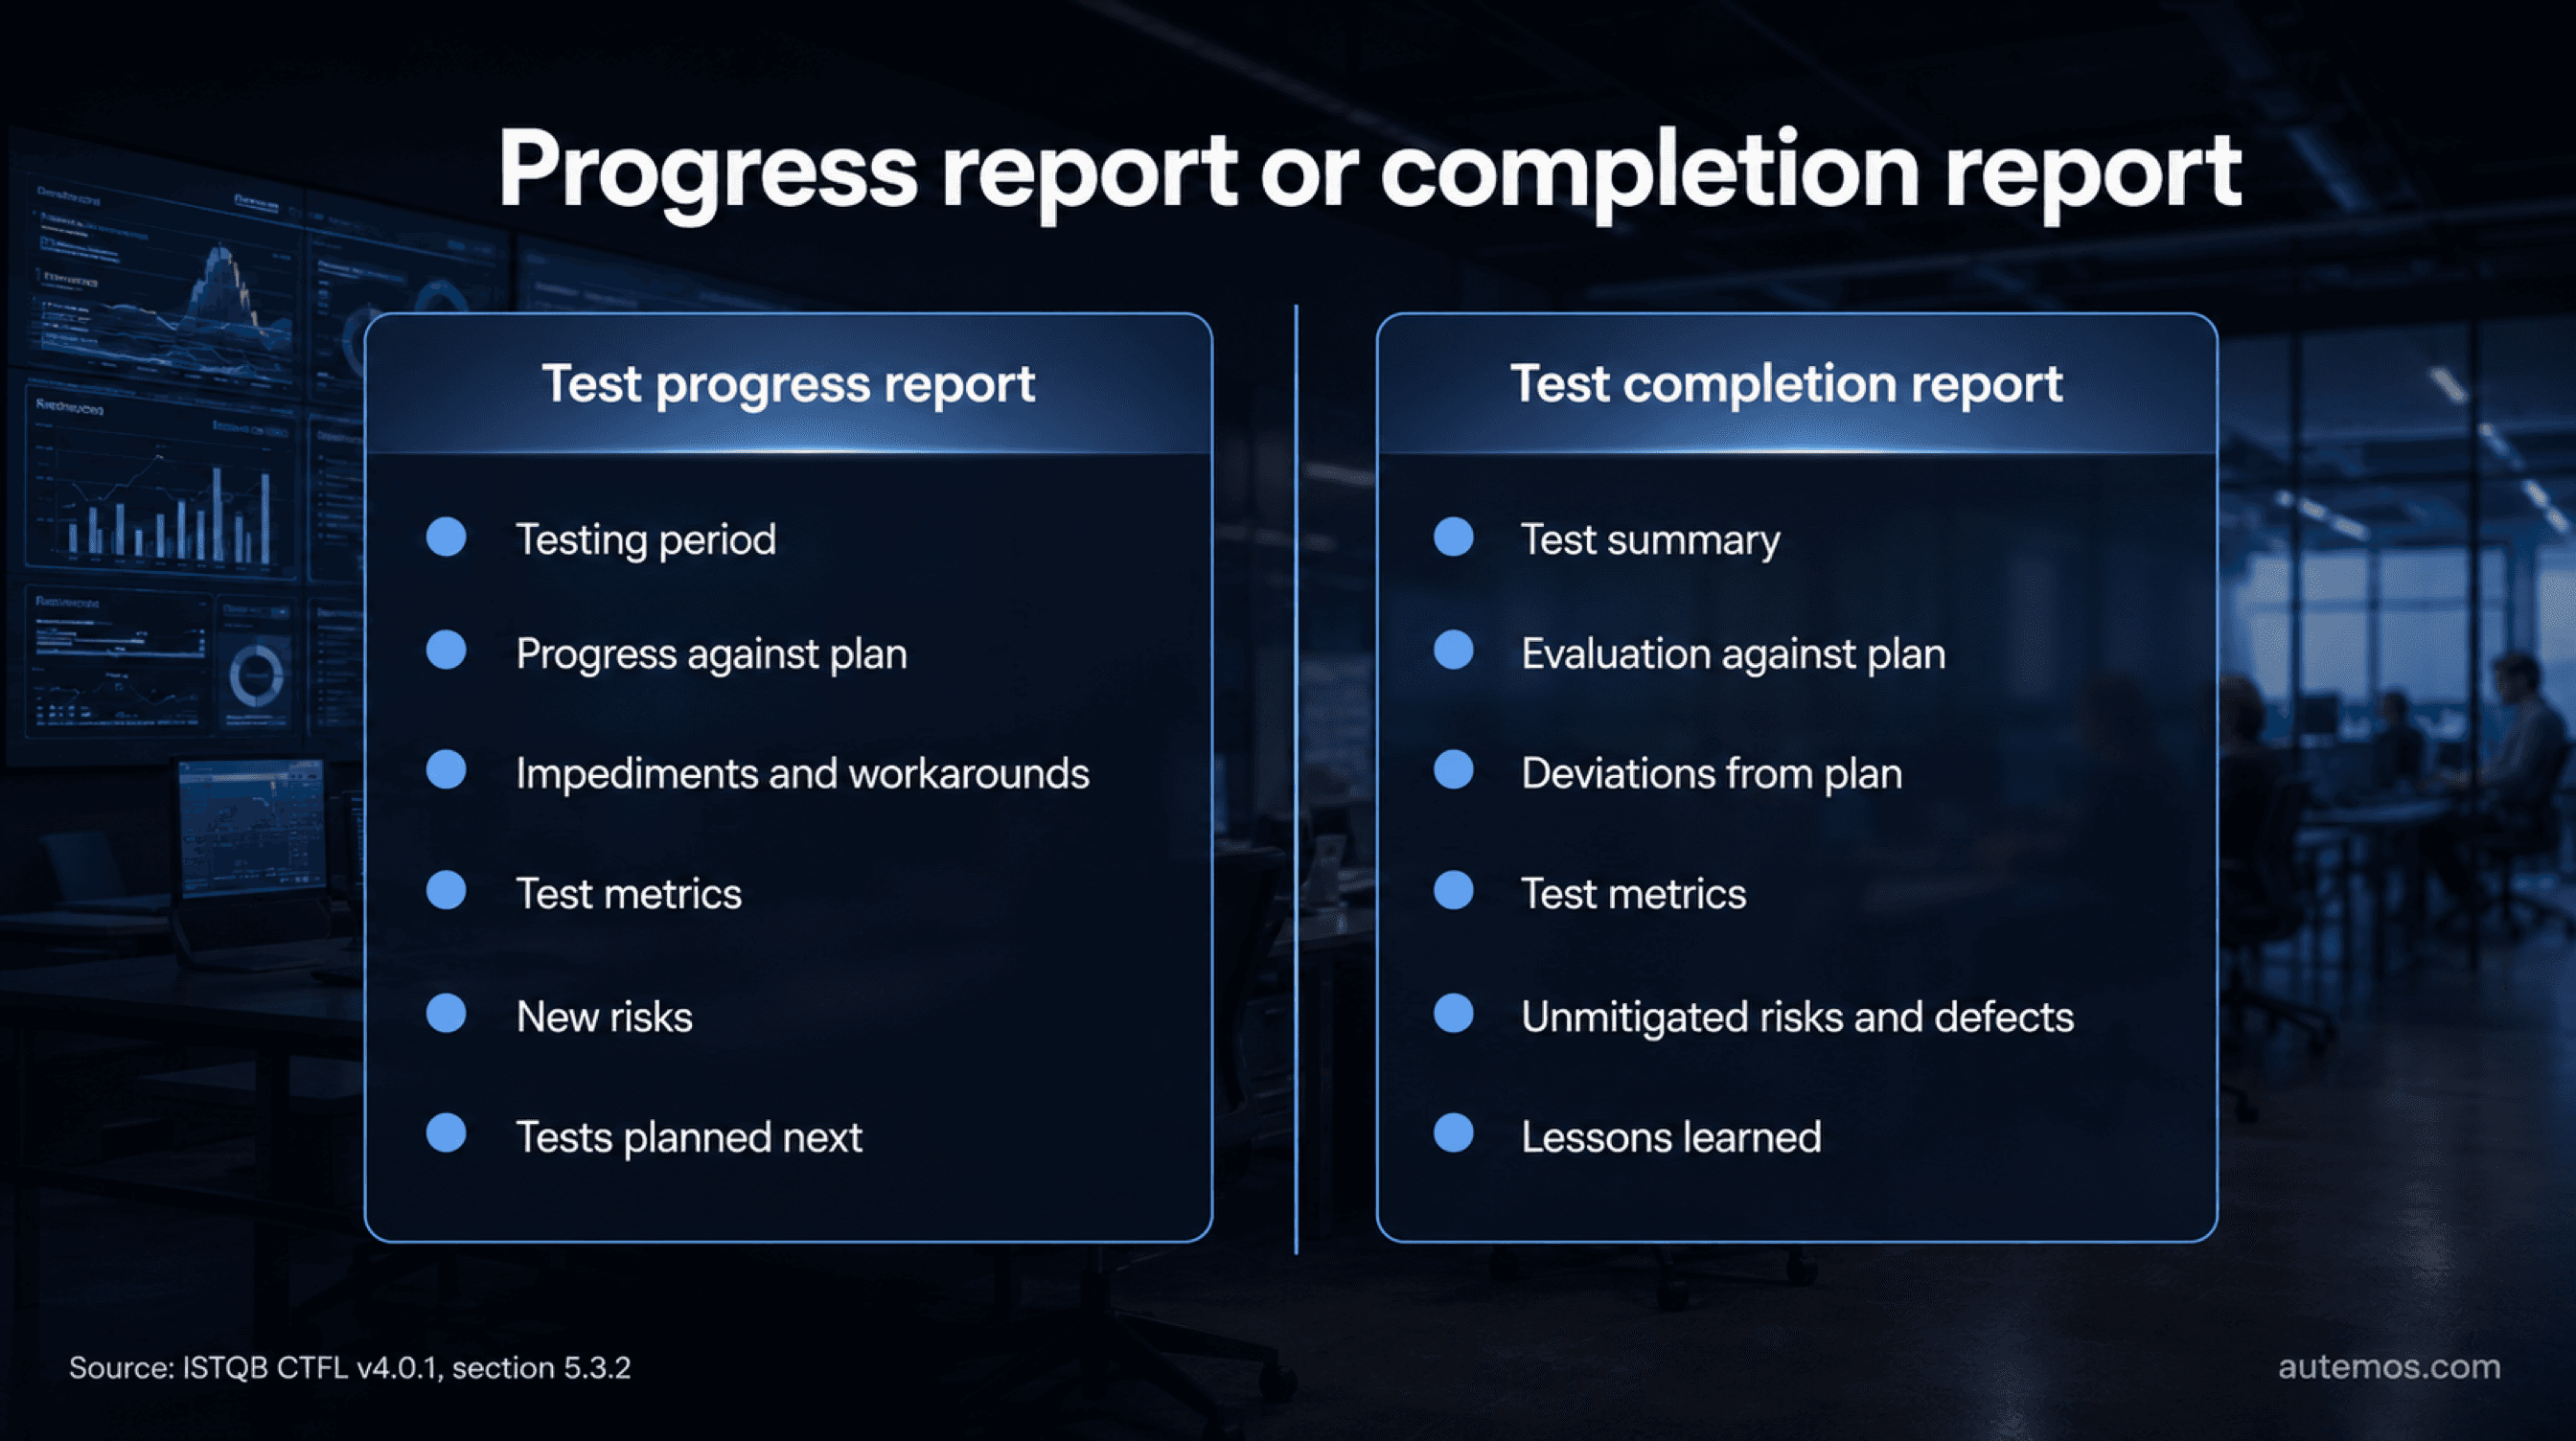
Figure 2: Contents of the progress and completion reports per ISTQB CTFL v4.0.1, section 5.3.2.
Progress reports “support the ongoing test control and must provide enough information to make modifications to the test schedule, resources, or test plan”. Completion reports “summarize a specific test activity (e.g., test level, test cycle, iteration) and can give information for subsequent testing” (ibid.). The syllabus lists the contents of each:
Test progress report (§5.3.2) | Test completion report (§5.3.2) |
|---|---|
testing period | test summary |
test progress, ahead or behind schedule, including any notable deviations | testing and product quality evaluation based on the original test plan, its objectives and exit criteria |
impediments for testing, and their workarounds | deviations from the test plan |
test metrics | testing impediments and workarounds |
new and changed risks within the testing period | test metrics based on the test progress reports |
testing planned for the next period | unmitigated risks, defects not fixed |
lessons learned relevant to the testing |
Which test metrics are worth reporting?
The metrics worth reporting are the ones that support a release decision. ISTQB states the purpose in section 5.3.1: “Test metrics are gathered to show progress against the planned test schedule and budget, the current quality of the test object, and the effectiveness of the test activities with respect to the test objectives or an iteration goal.” (ibid.). The syllabus groups them into project progress, test progress, product quality, defect, risk, coverage and cost metrics.
Four figures have clean definitions and earn their place in the report:
Defect density: defects identified in a component or system divided by its size, in lines of code or function points (ISTQB Glossary).
Defect Detection Percentage (DDP): defects found by a test level divided by the sum of those plus defects found by any other means afterwards (ISTQB Glossary).
Escaped defects: defects found after the team declared the work done, typically in production (Plandek).
Mean Time to Detect: the time between a defect entering the system and testing finding it.
Target bands circulate online for the last two (“under 10 % is excellent”). We do not print them: no available source shows a methodology behind the number. Track your own time series across releases of the same product instead. The trend tells you whether that test level is improving; an outside industry figure does not.
Why does code coverage say little about quality?
Code coverage measures which share of the code a test run executed, which is a different question from how many faults the suite finds. Inozemtseva and Holmes studied five large open-source Java projects of roughly 100,000 lines of code and more than 1,000 test methods each. Their finding: the link between coverage and fault-detection effectiveness is low to moderate once test-suite size is controlled for, and stronger criteria such as branch coverage give no more insight than statement coverage (ICSE 2014).
Mutation analysis gives a better signal. Just and colleagues examined 357 real faults across five open-source applications totalling around 321,000 lines of code and found that the mutant-detection rate tracks real-fault detection independently of code coverage (FSE 2014).
There is a second effect, described by economist Charles Goodhart in 1975 and summarised in its familiar wording by Marilyn Strathern: “When a measure becomes a target, it ceases to be a good measure.” That is an observation from economics, not a software-engineering study. It still describes what happens when a team is held to 90 % coverage: the number arrives, the assertions do not. Treat coverage as a side condition in your quality gates rather than a headline goal, and see our piece on test coverage for the longer argument.
Why does a pass rate lie when tests are flaky?
A pass rate is only as honest as the stability of the tests behind it, and in large codebases unstable tests are routine. Atlassian Engineering writes about its own repositories: “Test flakiness has been a significant contributor to build reliability issues in the past, responsible for as much as 21% of master build failures in the Jira Frontend repository.” (Atlassian Engineering, 8 December 2025).
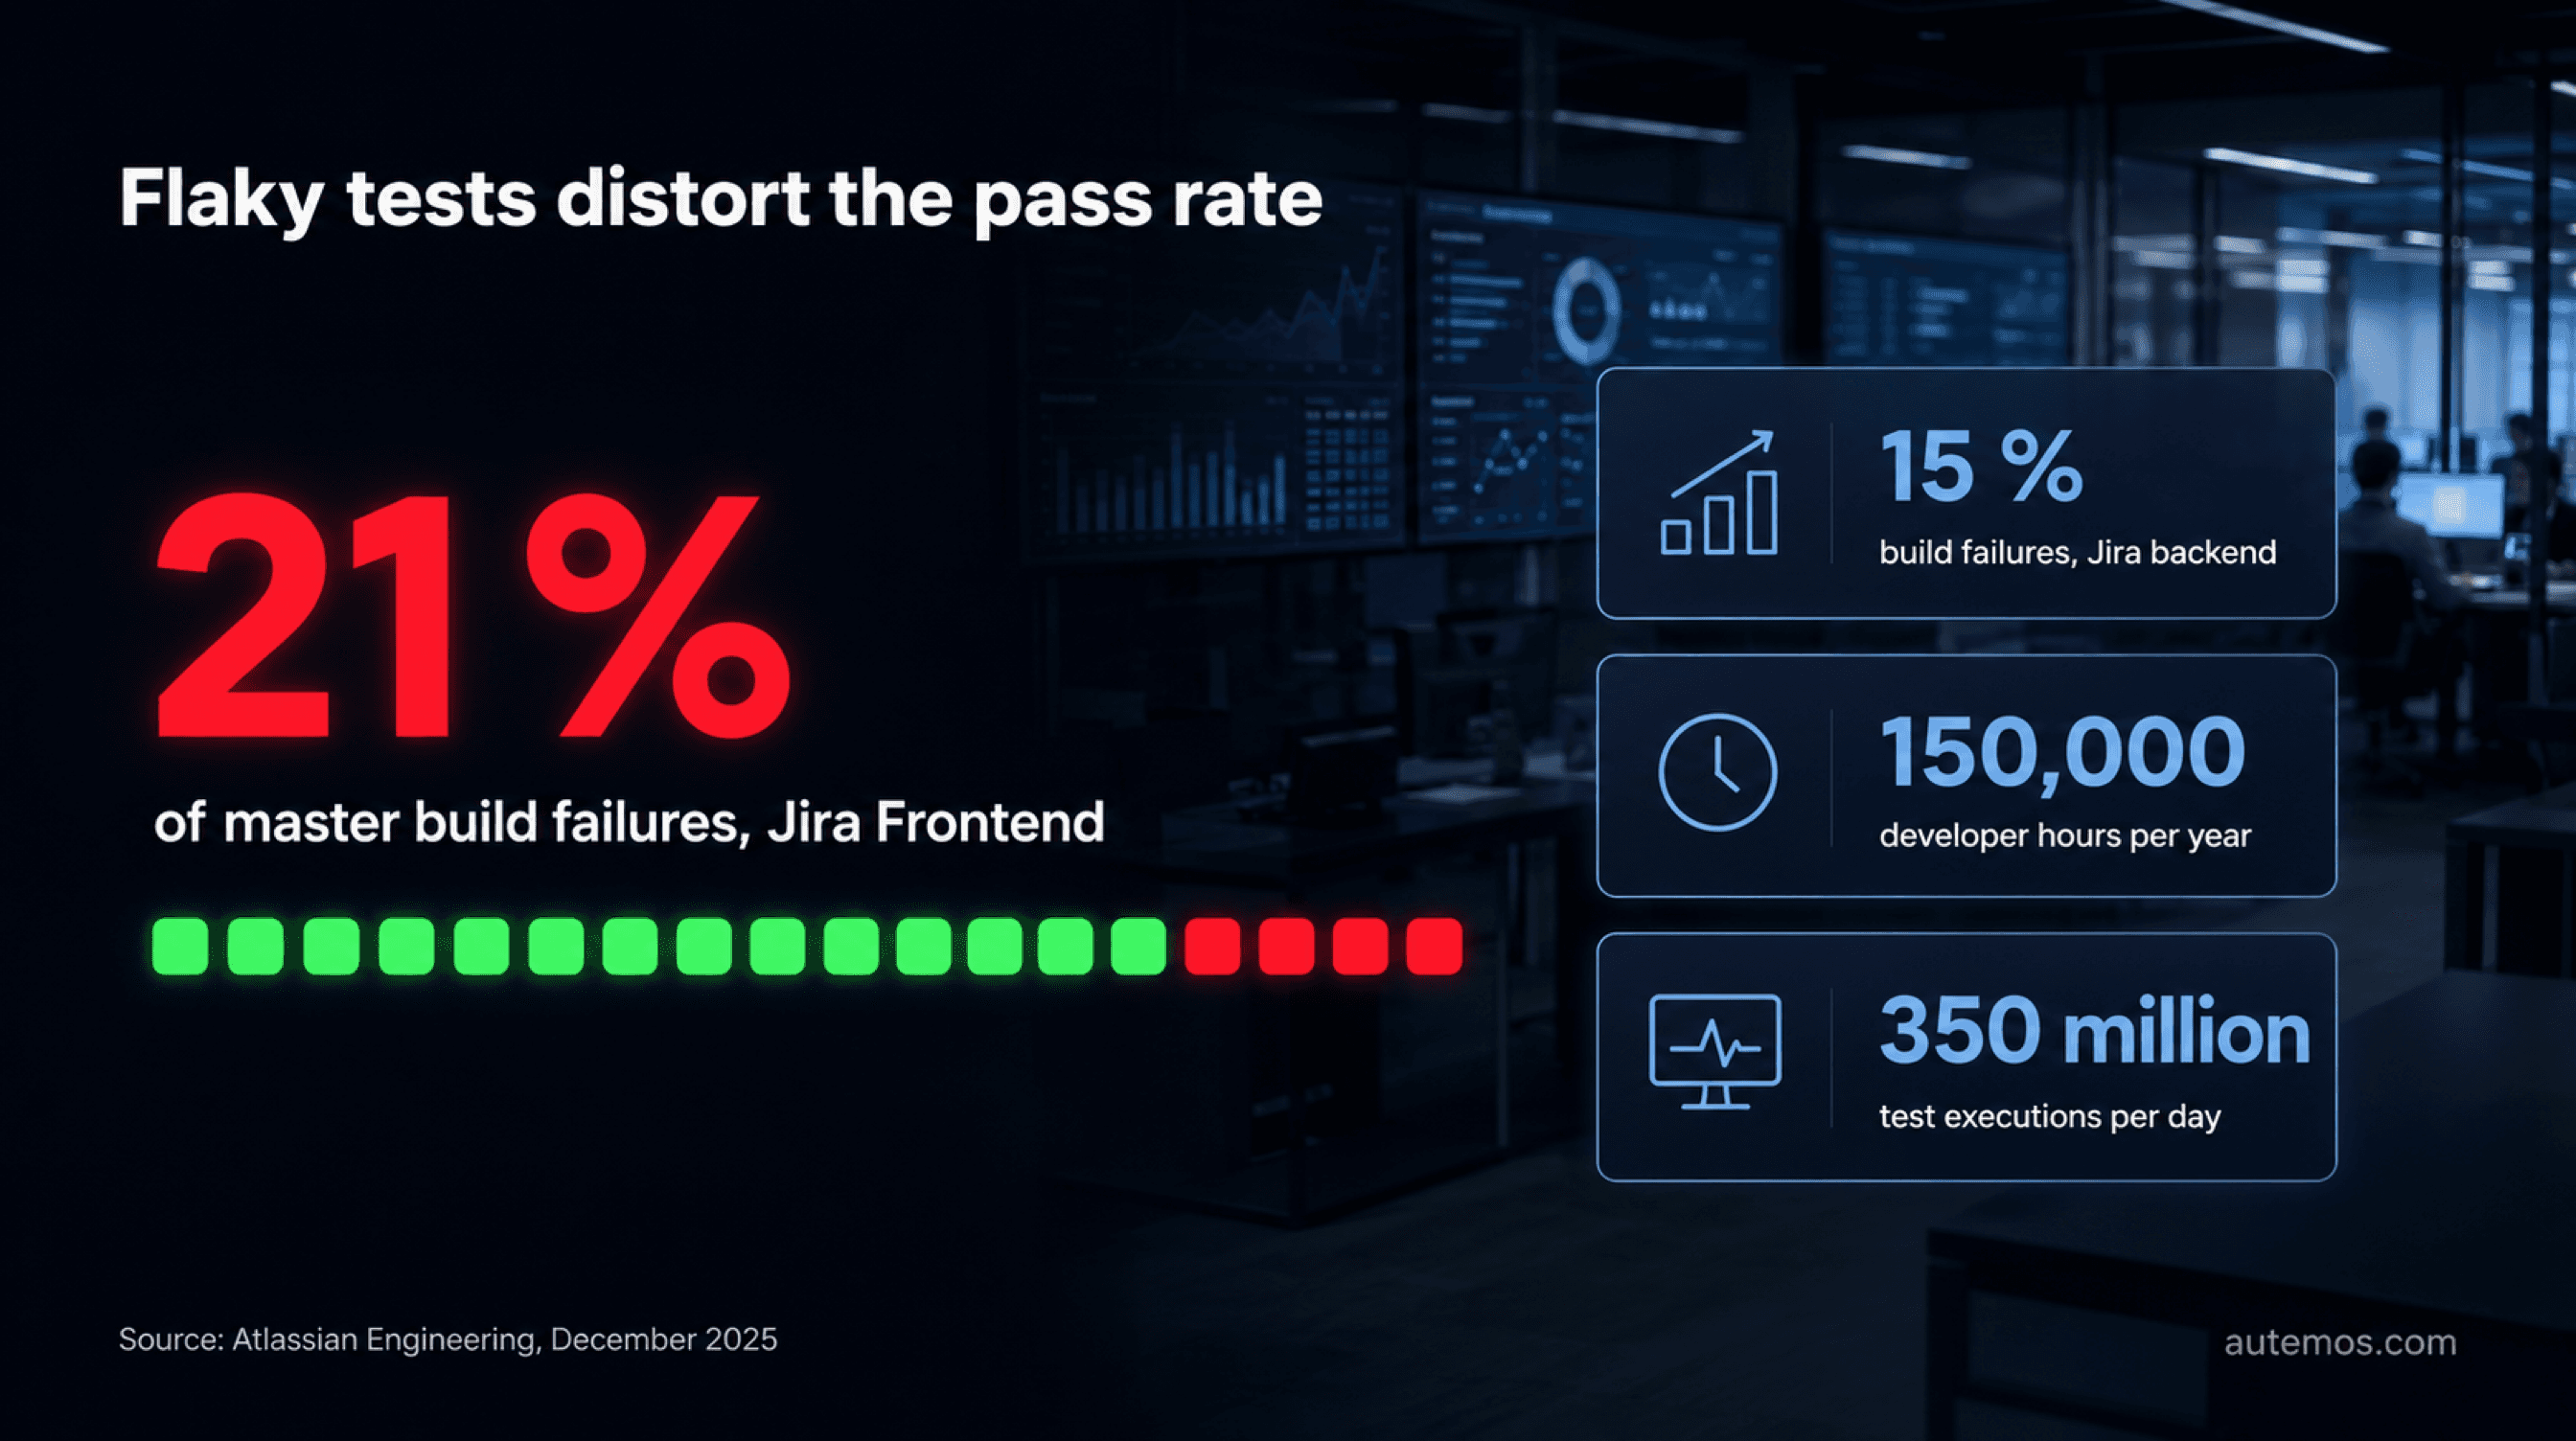
Figure 3: Flaky tests distort the pass rate. Figures from Atlassian Engineering, December 2025.
In the Jira backend repository Atlassian attributes about 15 % of failures to flaky tests, with the resulting reruns wasting over 150,000 hours of developer time each year. Their internal tool processes more than 350 million test executions per day across 12+ Atlassian products (ibid.). Comparable orders of magnitude appear secondhand in the same post: 13 % from Microsoft Research and 16 % from a Google study, both as cited by Atlassian Engineering.
If 1 in 6 failures is random, every green run reached through a silent retry deserves the same suspicion. Four additions make the report usable again:
the number of reruns that produced the green result
the list of tests marked flaky or held in quarantine
the pass rate split between stable and quarantined tests
the history of the same test across recent runs
In client projects we regularly see a pass rate drop by several points once reruns are disclosed. The software did not get worse. The number got honest.
How does automated test reporting work in a CI pipeline?
Automated test reporting comes together in five steps, with nobody pasting screenshots into a document:
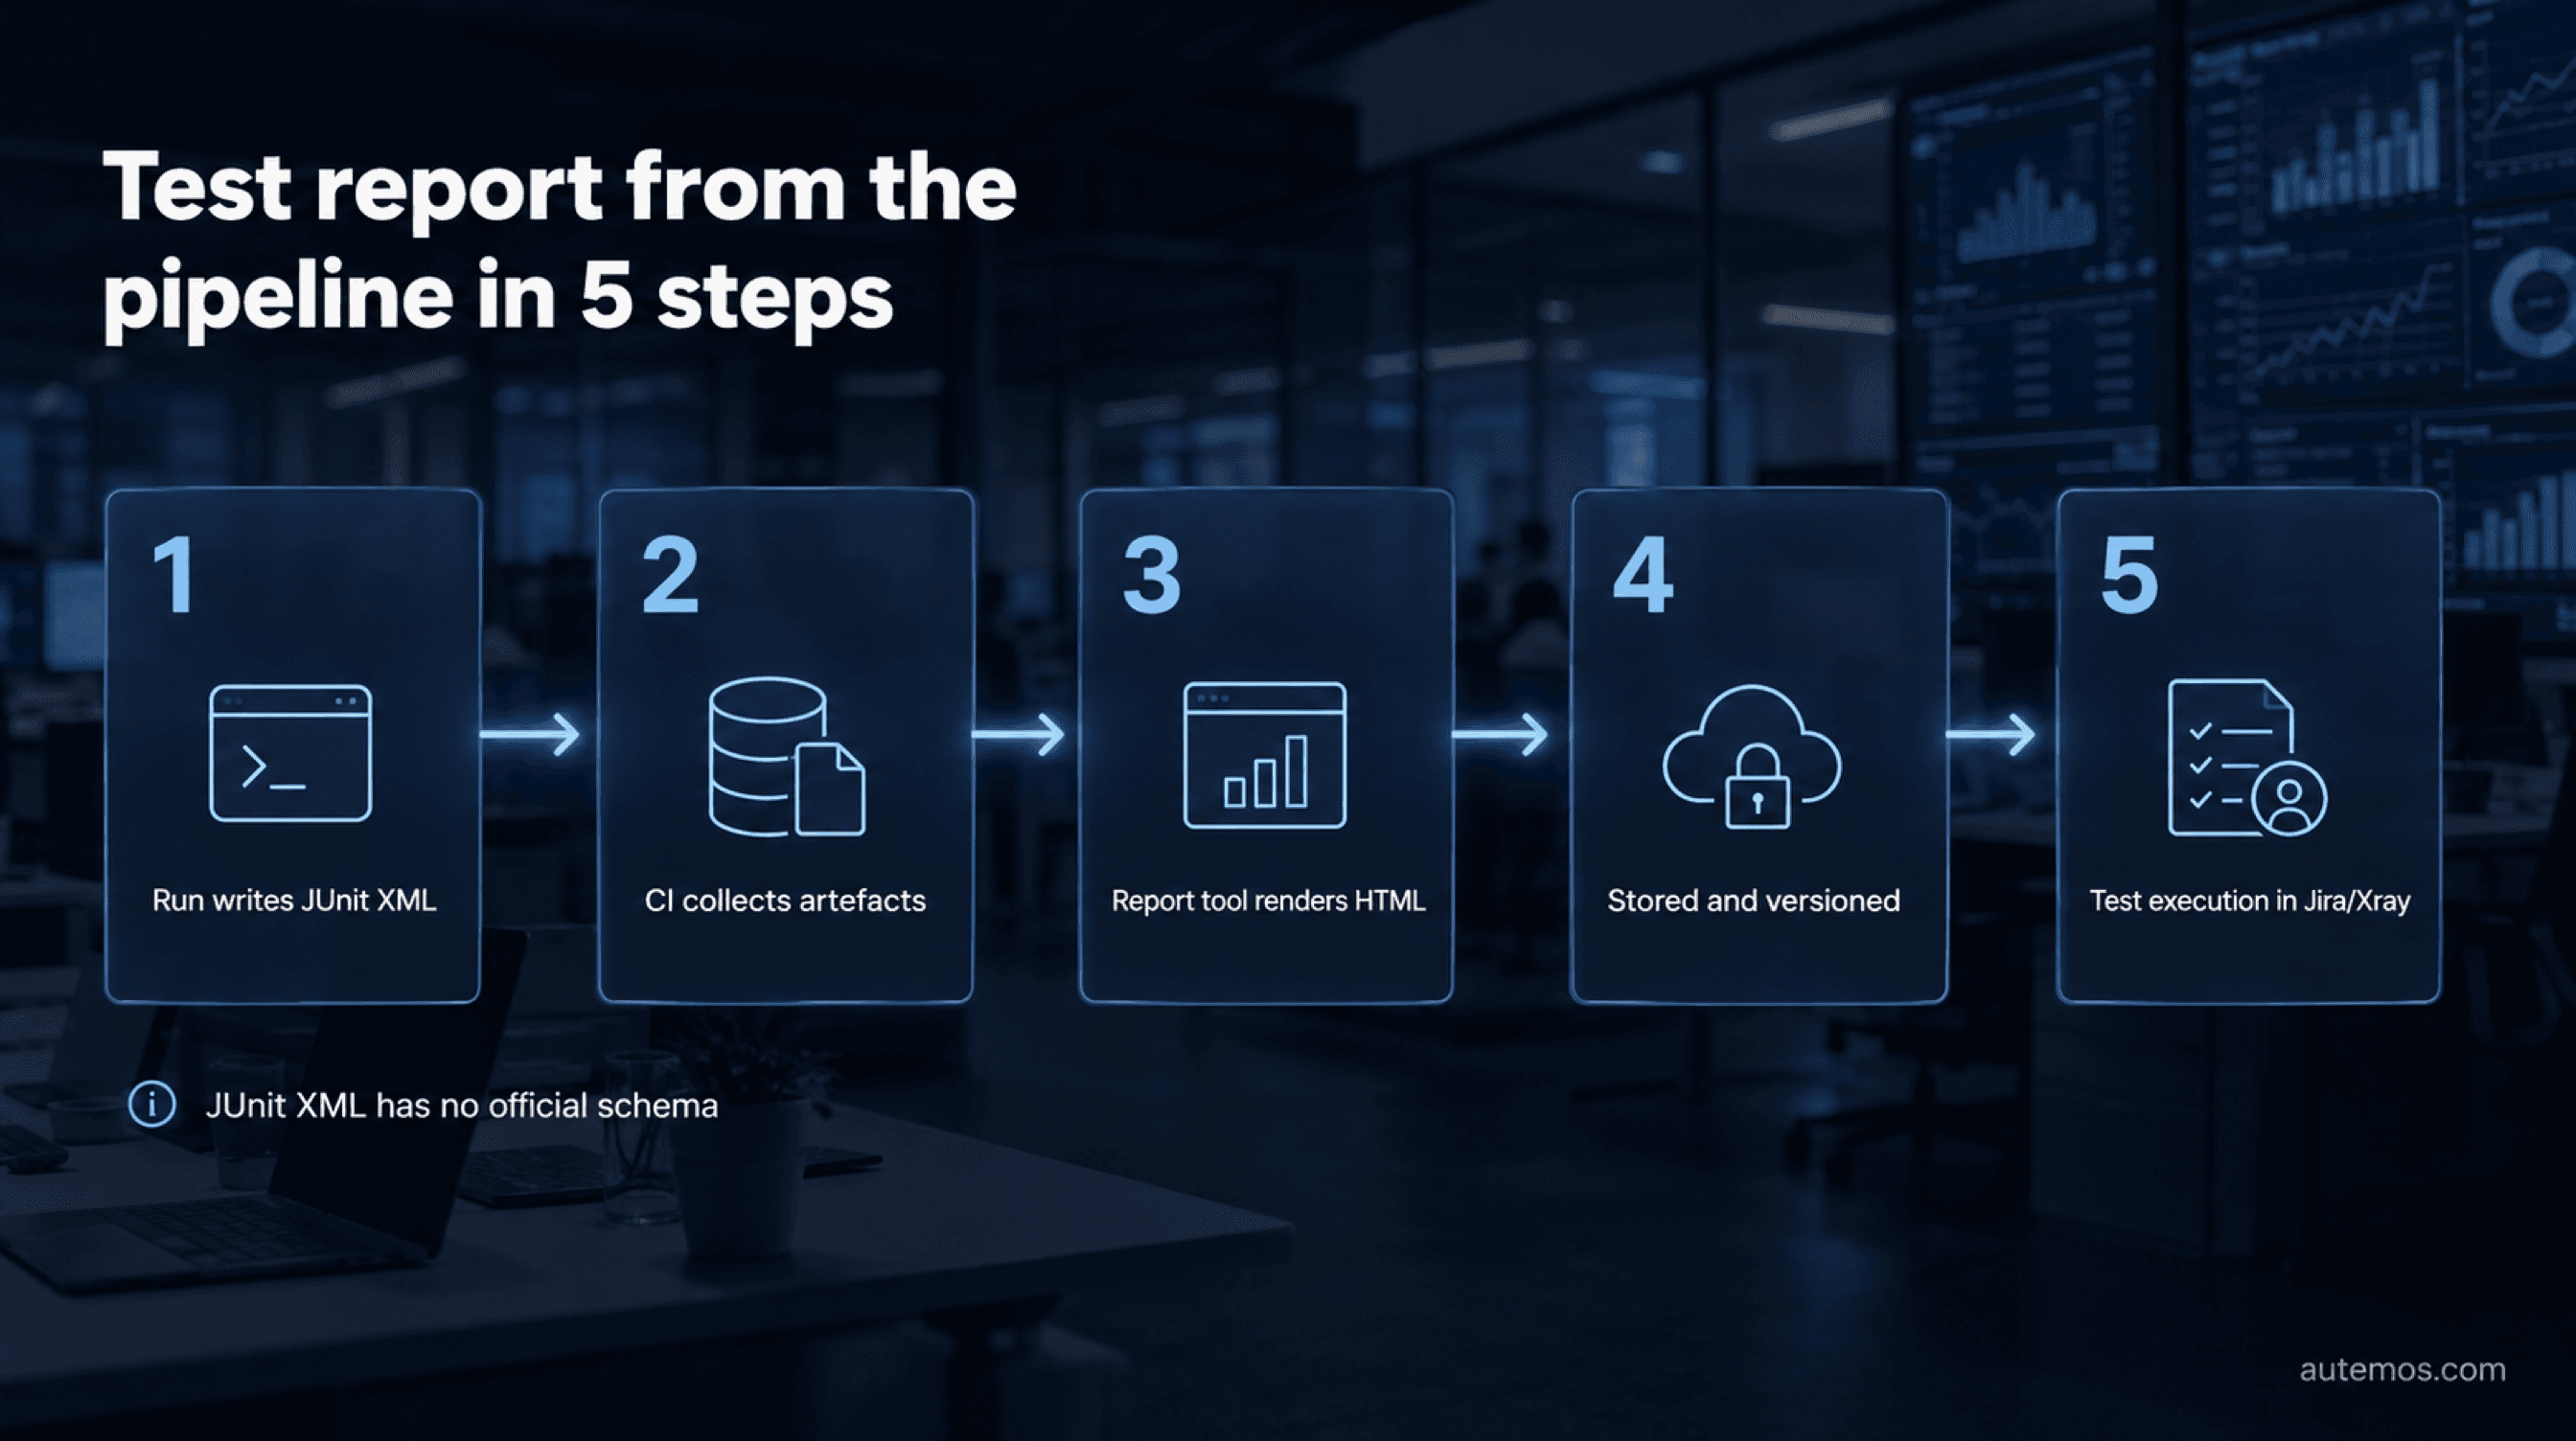
Figure 4: The automated path from test run to report in five steps.
The test run writes results. The framework produces machine-readable result files, usually JUnit XML, plus screenshots and logs as attachments.
CI collects the artefacts. The job archives the files so they outlive the build container.
A report tool renders them. Raw results become readable HTML with steps, attachments, history and trends.
The report is stored under version. With commit SHA, build number, timestamp and environment.
Results flow into the management layer. As a test execution in Jira/Xray, linked to requirements and releases.
Step 1 hides a known problem: JUnit XML has no official schema. The format is the de-facto interchange standard for test results between CI servers, report tools and test management systems, yet the variants have diverged (Ant-style versus Jenkins-style) and the available XSD files are outdated. Community projects document the conventions precisely since no authoritative specification exists (junitxml README). Expect one tool to ignore attributes the previous one wrote.
CI platforms differ in native test reporting more than teams expect. GitLab has a built-in feature called Unit test reports: the job outputs JUnit XML, `artifacts:reports:junit` in `.gitlab-ci.yml` points at it, and GitLab displays results in merge requests and pipeline views, comparing the source branch against the target (GitLab Docs). It does not change the job's pass/fail status on its own; the exit code still decides that. GitHub Actions has no equivalent native feature. Third-party Marketplace Actions such as `dorny/test-reporter` and `mikepenz/action-junit-report` fill the gap (GitHub Community Discussion).
Allure Report or Allure TestOps?
Allure Report is an open-source, multi-language reporting tool from Qameta Software under the Apache-2.0 licence. Its README calls it “a flexible multi-language test report tool to show you a detailed representation of what has been tested and extract maximum from the everyday execution of tests.” (GitHub, checked 2026). The current major version is Allure Report 3, latest release 3.16.0 (checked 30 August 2026).
The report contains test steps, attachments such as screenshots and logs, categories, history, retries, trends and a timeline, with support for 50+ frameworks from JUnit through pytest and Playwright to NUnit (Allure Docs). Allure TestOps is a different product: the same vendor's commercial platform adding centralised result storage, per-test-case history across runs, live dashboards and test case management (Qameta).
Autemos writes its results as an Allure report and pushes them into Jira/Xray, since Autemos is an execution engine and not a test management tool. For the tools that cover the management layer, see our comparison of test management tools.
What does test reporting have to show auditors in regulated environments?
Auditors expect retained, dated and auditable testing evidence rather than one prescribed report template. Neither DORA nor FINMA Circular 2023/1 contains a clause specifying the content of a test report. The duty is written more broadly: DORA (Regulation (EU) 2022/2554) requires a digital operational resilience testing programme in Articles 24 to 27, and Article 25 names vulnerability assessments together with scenario-based, compatibility, performance and penetration testing, scaled to the entity's size and risk profile (EUR-Lex).
Two paragraphs of Article 24 still tell you something about reporting. Paragraph 5 requires financial entities other than microenterprises to “establish procedures and policies to prioritise, classify and remedy all issues revealed throughout the performance of the tests” and to run internal validation methodologies confirming that identified weaknesses are fully addressed. Paragraph 6 requires them to ensure “at least yearly, that appropriate tests are conducted on all ICT systems and applications supporting critical or important functions” (ibid.). A bare percentage evidences neither duty. Defect status, age, classification and residual risk do.
FINMA Circular 2023/1 on operational risks and resilience for banks has been in force since 1 January 2024 and expects documented ICT risk management, a current IT asset inventory and effective vulnerability management (FINMA). For the report itself: stored immutably, dated and versioned, traceable to a requirement, never quietly amended.
Generated reports fail on that last point more often than people assume. If a tool repairs a broken locator by itself and reports the run green, the incident vanishes from the evidence. Autemos logs every self-healing action visibly and has a human confirm it. The link from a result back to a requirement comes from the traceability matrix, and in a continuous testing pipeline that evidence is produced on every run.
Frequently asked questions
Which standard applies to test documentation today?
ISO/IEC/IEEE 29119-3:2021 is the current edition of the test documentation part of the 29119 series and supersedes the 2013 version (IEEE SA).
What is the difference between a test report and a test summary report?
They describe the same artefact, with the 29119 naming being current: Test status report during testing, Test completion report at the end of an activity. Test Summary Report is the older IEEE 829-2008 term and reads as dated in an audit context.
How many metrics does test reporting need?
As few as the decision requires. Coverage against requirements and risks, execution status, the defect picture by severity and the named residual risk cover most release meetings. DDP and defect density earn their keep as a time series.
Is a 100 % pass rate a good sign?
Only alongside the information on how it was reached. Atlassian attributes up to 21 % of failures in the Jira Frontend repository to flaky tests (Atlassian Engineering, 2025). Without a rerun count and a quarantine list, a pass rate cannot be interpreted.
Does Allure Report replace a test management tool?
No. Allure Report produces per-run HTML reports with limited cross-run history. Central storage, test case management and long-term history come from the commercial Allure TestOps or a tool such as Xray in Jira.
Conclusion
Good test reporting answers three questions: what was covered, what is still open, and which risk the release carries. ISO/IEC/IEEE 29119-3:2021 supplies the document types, ISTQB v4.0.1 lists the contents of both report types, and the whole thing can come from the pipeline: JUnit XML from the run, Allure for the rendering, results pushed to Jira/Xray. Two numbers deserve suspicion: code coverage as a quality proxy, which the ICSE 2014 research links only weakly to fault detection, and any pass rate reported without its rerun count.
Want to see how Autemos delivers results as an Allure report and as a test execution in Jira/Xray? Talk to our team.