·
9 min
How to calculate test automation ROI: formula, cost drivers and an honest business case

Roman Kirchmeier - Autemos

You calculate test automation ROI, per the ISTQB CT-TAS syllabus, as a ratio: manual test time saved divided by the time invested in setup, scripts, maintenance and execution. Above 1, automation has paid for itself. When that happens depends on two numbers: how much manual testing you replace and how much maintenance your scripts need. A peer-reviewed industrial study calculated break-even at Saab at about 180 weeks (Alégroth et al., 2016). Short projects often don't pay back. Our guide to test automation covers the wider rollout.
TL;DR: The ISTQB CT-TAS syllabus (2024) defines ROI = Savings / Investment, measured in time. Savings are replaced manual test runs; investment is setup, script development, maintenance and execution. Above 1, the investment is recovered. Maintenance time and failure rate move break-even the most. Vendor studies claiming over 300% ROI don't replace your own calculation.

Figure 1: The ROI formula per ISTQB CT-TAS (2024)
How do you calculate test automation ROI?
The ISTQB Certified Tester Test Automation Strategy syllabus (CT-TAS v1.0, May 2024) defines test automation ROI as “ROI = Savings / Investment” (ISTQB CT-TAS, 2024). At 1.0, savings and investment are equal; above 1.0, automation has paid for itself; below, it hasn't yet.
Finance teams usually use a different form: ROI = (benefit − cost) / cost. It gives a percentage, with 0% as break-even. Both formulas measure the same thing on different scales: a CT-TAS ratio of 1.5 equals +50% in the finance form.
CT-TAS works in hours and converts to money with a project rate afterwards. Both sides of the formula need the same unit: convert license fees into hours, or all hours into francs.
Which metrics go into the ROI calculation?
CT-TAS lists four savings metrics and eight investment metrics, including the percentage of failing automated scripts (failure rate from here on) and the average maintenance time per script.
Side of the formula | CT-TAS metric | Where the value comes from |
|---|---|---|
Savings | Time to run a test manually | Time tracking, test management |
Savings | Time to run it automated | Pipeline logs |
Savings | Number of test cases | Regression suite |
Savings | Number of test runs | Release and sprint plan |
Investment | Setup time (framework, pipeline, training) | Project plan, pilot |
Investment | Average script development time | Pilot |
Investment | Number of scripts | Automation backlog |
Investment | Average maintenance time per script | Pilot, later tickets |
Investment | Automated run time | Pipeline logs |
Investment | Percentage of failing automated scripts | Test reports |
Investment | Number of test cases and number of runs | As above |
According to the syllabus, applying the test pyramid cuts execution time and improves ROI. Our guide on choosing which tests to automate covers which cases belong in the calculation.
Which steps lead to a defensible ROI calculation?
A defensible calculation takes six steps, from measuring manual effort to a review after a few sprints. CT-TAS recommends a pilot for this: “The use of a pilot project helps determine the tools and viability of selected technologies” (ISTQB CT-TAS, 2024).
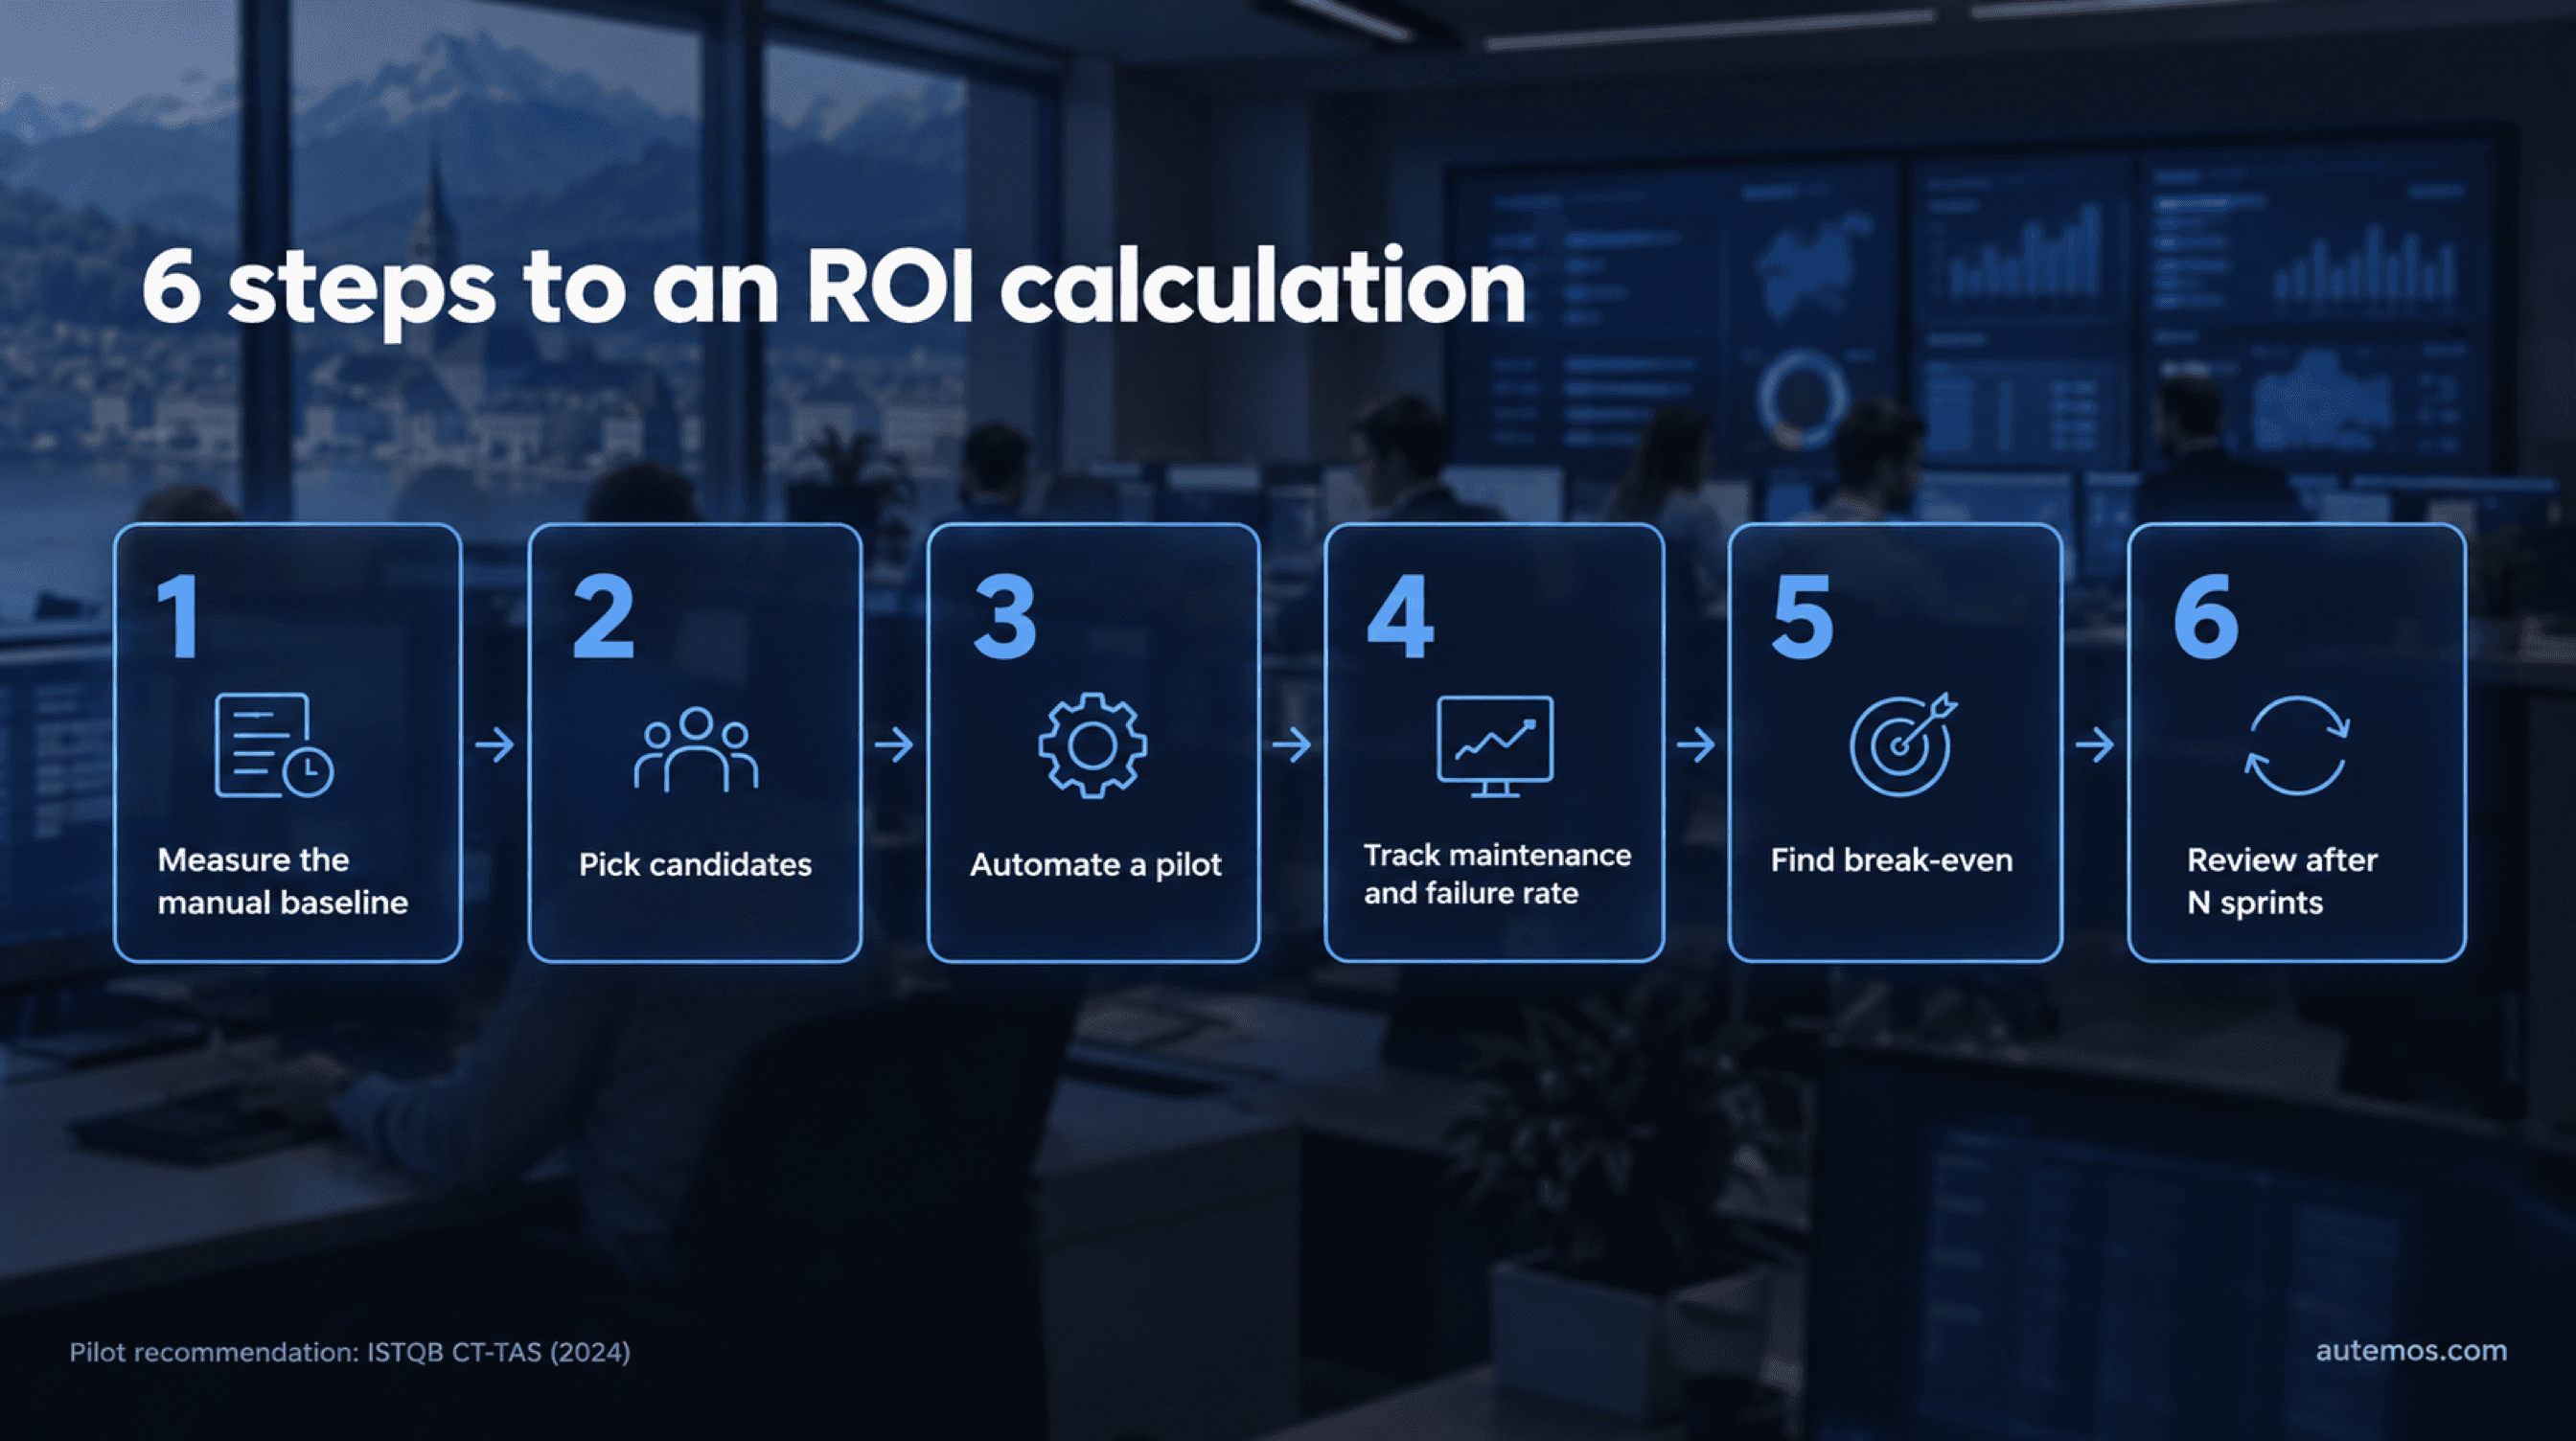
Figure 2: Six steps to a defensible ROI calculation
Measure the manual baseline. Record minutes per test case for the regression suite and runs per year. Use time tracking or test management data, not memory.
Pick candidates. Start with regression tests, which CT-TAS names as the easiest entry point. First check that the manual test runs reliably.
Automate a pilot. Automate 10 to 20 representative cases and measure setup time and development time per script.
Track maintenance and failure rate. Over several runs, note how many scripts fail and how long analysis and repair take.
Project forward and find break-even. Add up savings and investment per run and find the run where the ratio reaches 1.0. Compare it with the planned project duration.
Review after N sprints. After roughly six sprints, replace pilot values with real data and recalculate.
The assumptions behind this calculation belong in your test strategy, with its goals and metrics.
What does a worked ROI example show?
In this illustrative calculation, a regression suite of 200 test cases with monthly releases breaks even at run 15. Every hour value is an assumption based on the CT-TAS time model, not a measurement from a real project. Replace each row with your own pilot data.

Figure 3: Illustrative example with assumed values, break-even at run 15
Assumption (example) | Value |
|---|---|
Test cases in the regression suite | 200 |
Manual time per test case | 30 min (100 h per regression run) |
Runs per year | 12 |
Setup: framework, pipeline, training | 160 h |
Development per script | 3 h (600 h total) |
Failing scripts per run | 15% (30 scripts) |
Analysis and maintenance per failing script | 45 min (22.5 h per run) |
Supervising the automated run | 2 h per run |
Parallel phase, manual testing continues | First 3 runs |
Result (example) | Savings | Investment | CT-TAS ratio | Finance form |
|---|---|---|---|---|
After 12 runs (year 1) | 900 h | 1,054 h | 0.85 | −15% |
After 15 runs | 1,200 h | 1,128 h | 1.06 | +6% |
After 24 runs (year 2) | 2,100 h | 1,348 h | 1.56 | +56% |
With monthly releases, that's 15 months. A project with 12 months left wouldn't recover the investment. If the failure rate rises from 15% to 30%, break-even moves to run 20. At 5%, it would arrive at run 12.
To get to Swiss francs, you need an hourly rate. The SwissICT salary survey 2025 reports a median of CHF 130,060 at senior level (itreseller, 2025).
With an assumed 20% employer on-cost and 1,800 working hours a year, the SwissICT senior median, used here as an assumption for an experienced tester, gives roughly CHF 87 per hour. The example then costs about CHF 91,700 in year 1 against CHF 78,300 in savings. The ratio stays at 0.85. License fees would go straight onto the investment side in francs.
When does test automation break even?
Test automation breaks even once cumulative savings exceed cumulative investment, and that can take years. In a peer-reviewed study of Visual GUI Testing, break-even for a modeled project spending 20% of its time on testing came at about 45 weeks; at Saab, with about 7% of time on manual testing, it came out at about 180 weeks (Alégroth et al., 2016).

Figure 4: Calculated break-even in weeks per Alégroth et al. (2016)
With infrequent big-bang maintenance, the Saab figure grew to about 532 weeks, roughly ten years. The authors conclude that the less time a company spends on manual testing today, the longer it takes to reach positive ROI. This is one industrial study of GUI tests at Siemens and Saab. Don't copy the weeks straight into your plan.
CT-TAS draws an uncomfortable conclusion: “If the planned project duration is less than the turning point of the ROI, it is not worth introducing test automation” (ISTQB CT-TAS, 2024).
Why do costs rise during the transition?
Costs rise during the transition: manual and automated tests run in parallel for a period. CT-TAS puts it plainly: “the project should expect increased costs as both manual testing and automated testing take place simultaneously”. Budget this phase as its own line, as with the three parallel runs in the example above.
The syllabus warns against automating a failing manual regression test before its root cause is clear. Sort out those cases before the pilot.
Why does maintenance decide the ROI?
Maintenance time per script decides break-even: it comes back with every run after setup, and in one industrial study it ranged from about 23 minutes (best case) to 110 minutes (neglected suite) per script. One manual test case took 29 minutes (Alégroth et al., 2016). Their finding: “frequent maintenance is less costly than infrequent, big bang maintenance”.
Unstable tests push up the failure rate. At Google, about 1.5% of all test runs reported a “flaky” result, and almost 16% of tests showed some level of flakiness (Google Testing Blog, 2016). A year later, 14% of large tests were flaky, compared with 0.5% of small tests (Google Testing Blog, 2017).
Each failure costs analysis time, real defect or not. Concrete ways to bring maintenance down are in our article on reducing test maintenance with AI.
Where does Autemos fit into the calculation?
Autemos is AI-assisted test automation software that automates functional tests for web, mobile, API and desktop. In the ROI calculation it acts on one CT-TAS metric: average maintenance time per script. Self-healing locators adapt changed element locators, and every heal is documented and reversible. The mechanics are explained in our piece on how self-healing locators work.
We deliberately don't give a savings figure for this; measure the effect in your pilot. The second lever is exit cost. Autemos exports web tests as Playwright code (Java or TypeScript) and mobile tests as Appium (Java), synced to Git, and the tests run without Autemos. How tools differ on licensing and lock-in is covered in our test automation tools comparison. Autemos won't calculate your ROI for you.
Which ROI numbers don't belong in your business case?
Two widely quoted sources of numbers don't hold up: the “1:10:100 rule” for defect costs and vendor-commissioned studies with triple-digit ROI percentages.
Is the 1:10:100 rule true?
The 1:10:100 rule has no reliable empirical support. Menzies et al. tested the “delayed issue effect” across 171 projects: “We found no evidence for the delayed issue effect” (Menzies et al., 2016). The often-cited “IBM Systems Sciences Institute” was, per Laurent Bossavit's research, an internal training program (The Register, 2021).
Late defects can be expensive in specific cases, such as a production incident in a bank's payment processing. The evidence doesn't support a fixed multiplier. Use your own incident costs if you include avoided defects in the business case.
What is a Forrester TEI study with 336% ROI worth?
Forrester Consulting's Total Economic Impact (TEI) studies are commissioned by a vendor. A study on Tricentis Tosca from August 2026 reports 336% ROI and an 8-month payback, based on five decision-makers; the page states: “This study is commissioned by Tricentis” (Forrester TEI, 2026).
TEI studies model one composite organization from a handful of customer interviews. In October 2026, the Tosca page described that organization once with 40 million and once with 40,000 employees. Such numbers don't belong in your business case, whichever vendor publishes them.
What benefits does the ROI formula miss?
The CT-TAS formula counts saved time; faster feedback and more stable releases aren't in it. Google's DORA research program (dora.dev, not the EU regulation of the same name) states: “Manual regression testing is time-consuming to execute and expensive to perform, which makes it a bottleneck in the process” (DORA, n.d.).
According to dora.dev, test automation improves software stability, reduces team burnout and lowers deployment pain. List these effects as a separate, qualitative line next to the ratio. Possible items:
Feedback time per merge request (dora.dev target: under ten minutes)
Number of production incidents caused by regressions
Tester time freed for new and deeper tests, a benefit the ISTQB CTFL 4.0 syllabus names
More frequent releases without extra manual regression effort
Frequently asked questions
What is test automation ROI?
Test automation ROI is a metric that compares manual test time saved with the investment in setup, scripts, maintenance and execution. The ISTQB CT-TAS syllabus defines it as “ROI = Savings / Investment”. A value above 1 means automation has paid for itself.
After how many test runs does automation pay off?
There's no universal number; break-even depends on maintenance, failure rate and the manual effort you replace. In the illustrative example above, it falls between runs 12 and 20, depending on the failure rate. The Saab case in Alégroth et al. (2016) came out at about 180 weeks.
Which tests pay back fastest?
Frequently run, stable regression tests pay back fastest, and CT-TAS names them the easiest starting point. Tests that need a lot of human judgment, such as the loan application review in the syllabus example, are better left manual. The criteria are in our checklist on which tests to automate.
Does a new test tool guarantee a positive ROI?
A new tool doesn't guarantee a positive ROI. The ISTQB CTFL 4.0.1 syllabus states: “Simply acquiring a tool does not guarantee success” (ISTQB CTFL, 2024). It lists unrealistic expectations and inaccurate estimates of maintenance effort as explicit risks.
How often should you recalculate ROI?
Recalculate after the pilot and then roughly every six sprints. Each time, replace assumptions with measured values, above all maintenance time per script and failure rate.
Conclusion
Test automation ROI is a ratio of saved time to invested time, and it turns positive only after months of runs. Calculate with the CT-TAS formula, measure the values in a pilot and budget the parallel phase as a cost. Check break-even against the project duration: if it falls later, skip automation.
Maintenance time per script and failure rate move the result the most. Track both in your reporting from the first run. Keep 100x rules and commissioned studies out of the calculation. Want to see how self-healing and code export change maintenance and exit costs in your pilot? Talk to the Autemos team.


